* The Accumulation Distribution Line is a cumulative measure of each period's volume flow, or money flow.
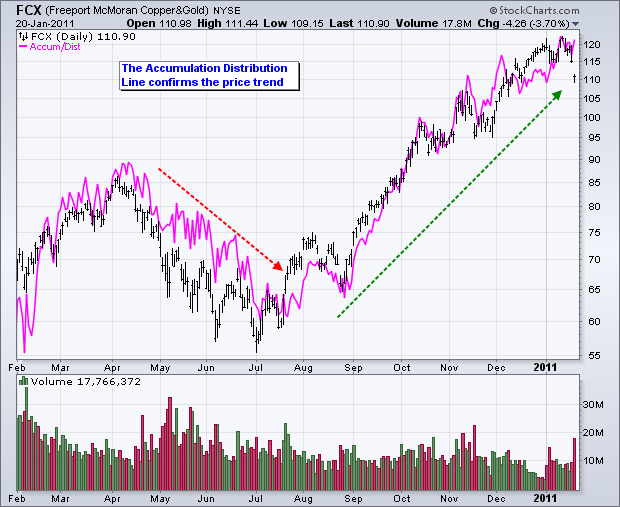
* Money Flow Volume accumulates to form a line that either confirms or contradicts the underlying price trend. In this regard, the indicator is used to either reinforce the underlying trend or cast doubts on its sustainability.
*An uptrend in prices with a downtrend in the Accumulation Distribution Line suggests underlying selling pressure (distribution) that could foreshadow a bearish reversal on the price chart.
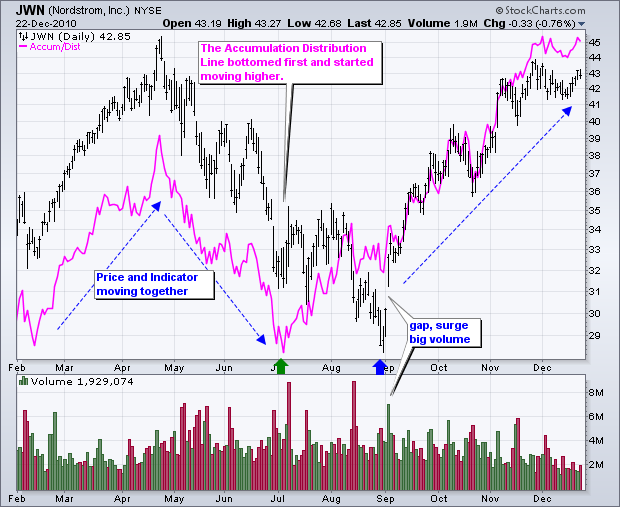
* A downtrend in prices with an uptrend in the Accumulation Distribution Line indicate underlying buying pressure (accumulation) that could foreshadow a bullish reversal in prices.
A bearish divergence forms when price moves to new highs, but the Accumulation Distribution Line does not confirm and moves lower. This shows distribution or underlying selling pressure that can foreshadow a bearish reversal on the price chart
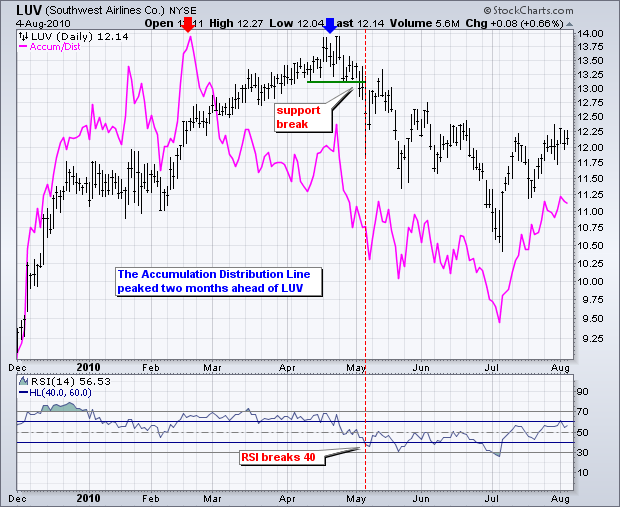
The chart above shows Southwest Airlines (LUV) with the Accumulation Distribution Line peaking two months ahead of prices. The indicator not only peaked, but it also moved lower in March and April, which reflected some selling pressure. LUV confirmed weakness with a support break on the price chart and RSI moved below 40 shortly afterward. RSI often trades in bull zones (40-80) and bear zones (20-60). RSI held in the bull zone until early May and then moved into a bear zone.
* Money Flow Volume accumulates to form a line that either confirms or contradicts the underlying price trend. In this regard, the indicator is used to either reinforce the underlying trend or cast doubts on its sustainability.
*An uptrend in prices with a downtrend in the Accumulation Distribution Line suggests underlying selling pressure (distribution) that could foreshadow a bearish reversal on the price chart.
* A downtrend in prices with an uptrend in the Accumulation Distribution Line indicate underlying buying pressure (accumulation) that could foreshadow a bullish reversal in prices.
Trend Confirmation
Trend confirmation is a pretty straight-forward concept. An uptrend in the Accumulation Distribution Line reinforces an uptrend on the price chart and vice verDivergences
Bullish and bearish divergences are where it starts getting interesting. A bullish divergence forms when price moves to new lows, but the Accumulation Distribution Line does not confirm these lows and moves higher. A rising Accumulation Distribution Line shows, well, accumulation. Think of this as basically stealth buying pressure. Based on the theory that volume precedes price, chartists should be on alert for a bullish reversal on the price chart.A bearish divergence forms when price moves to new highs, but the Accumulation Distribution Line does not confirm and moves lower. This shows distribution or underlying selling pressure that can foreshadow a bearish reversal on the price chart
The chart above shows Southwest Airlines (LUV) with the Accumulation Distribution Line peaking two months ahead of prices. The indicator not only peaked, but it also moved lower in March and April, which reflected some selling pressure. LUV confirmed weakness with a support break on the price chart and RSI moved below 40 shortly afterward. RSI often trades in bull zones (40-80) and bear zones (20-60). RSI held in the bull zone until early May and then moved into a bear zone.
Hiç yorum yok:
Yorum Gönder